an el niño is currently underway
it may last at least though to spring of 2019; see details at noaa’s el niño web site
climate prediction
Weather drives the computer models we use. Insect, disease, and plant development are dependent upon the weather: how warm or cool the temperatures have been, how much, if any, rainfall has there been, what do we expect today, tomorrow, or next week.
noaa-national weather service provides a variety of products from their climate prediction center that give us an opportunity to look ahead.
The first are the outlooks from six days to three months and beyond featured on the CPC home page. These are often featured in newspaper, radio, and television stories. However, more diving into their web site brings up additional features that can further help us to plan ahead.

Drought Monitor
(click on map for further information)
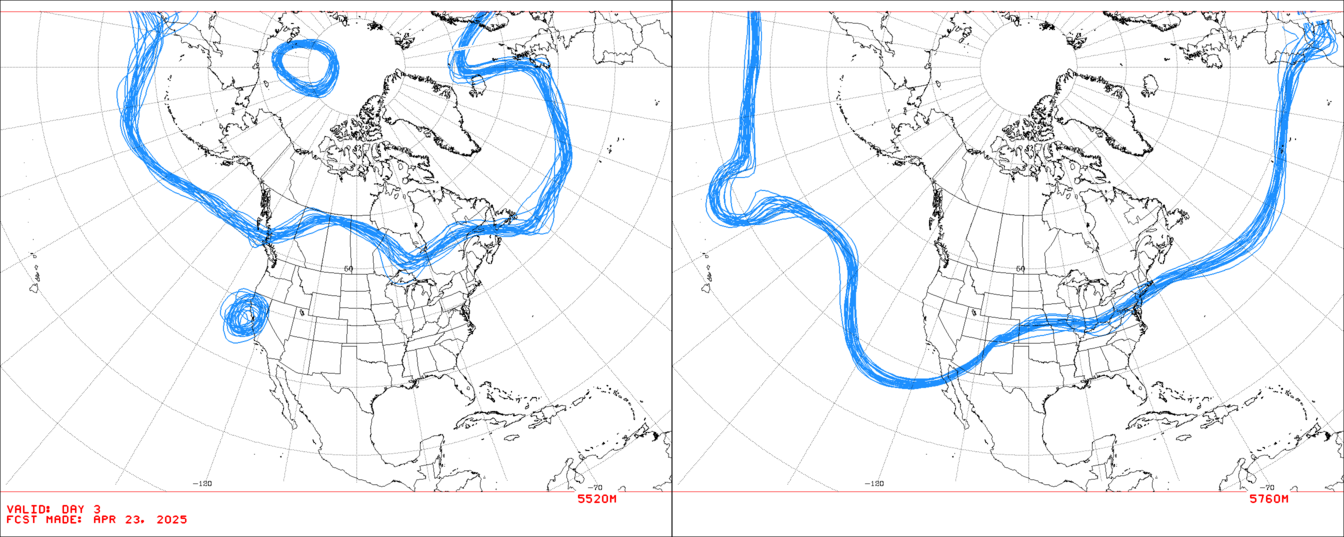
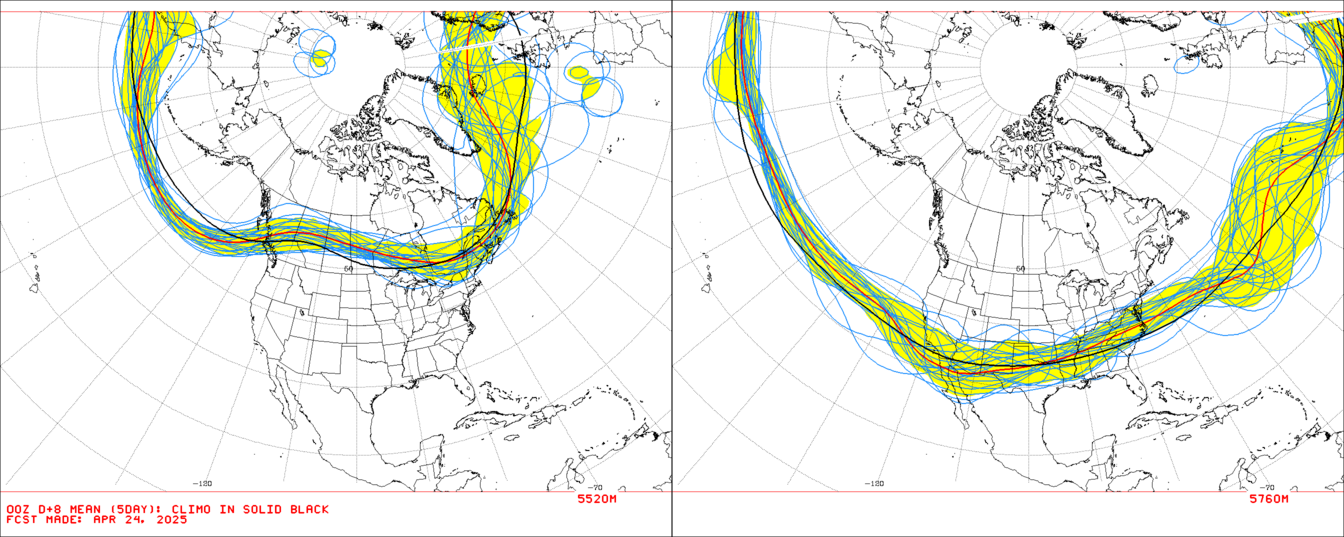
Hazards Assessment and Spaghetti Charts
The CPC’s hazards assessment highlights weather concerns over the 2 to 14 day period.

These highlights are based upon examination of a range of computer forecast models. When these models are superimposed on a map they produce the spaghetti maps. The maps are available for individual 3 to 7 day forecast, and then for days averaged around 8 and 11.
Current Jet Stream maps are available from the california regional weather server.
Teleconnections
Yet another aid for reading the future are the teleconnection charts. Climate scientists through extensive statistical analysis have uncovered global climate patterns. The one that affects us most during the winter is the Pacific / North American (PNA):
Above average values of the PNA will often bring us warmer, possibly wetter weather. Below average can mean cooler, drier weather.
El Niño/La Niña
Of course, no list would be complete without

Pacific Decadal Oscillation (PDO)

Whereas El Niño is an interseasonal effect, the pdo is an interdecadal effect following a 20 to 30 year cycle of cool to warm sea surface temperatures. Warm phases occurred 1925-1946 and 1977-1998 periods with cool phases in between. However, data on the cool phase that began in 1998 are mixed with a brief warm phase interrupting the pattern in 2003-2005.
related links
- wsu agweathernet
- national digital forecast database
- office of the washington state climatologist
- california regional weather server
- gridded evapotranspiration forecast for eastern washington (currently not working?)
- cliff mass weather blog(NW meteorologist)
- inland northwest weather blog
- community cloud atlas blog
- prism climate group(OR State Univ)
